Send logs from Node.js Pino without requiring Otel collectors to SigNoz Cloud and Self-hosted
Overview
This guide demonstrates how to configure Pino to send logs directly to SigNoz Cloud or Self-hosted SigNoz without using OpenTelemetry collectors. Following this documentation will enable you to stream your Node.js application logs directly to your SigNoz dashboard.
Here's a quick summary of what we will be doing in this guide
- Create Node.js application with pino logger
- Configure pino logger to send logs to SigNoz Cloud
- Send and Visualize the logs in SigNoz Cloud
Prerequisites
Before starting ensure you have:
- A SigNoz Cloud account with active subscription
- Access to your SigNoz Cloud:
- Ingestion endpoint URL
- Ingestion Key
- See SigNoz Cloud Configuration Guide for details on finding your ingestion URL and access token
Required Dependencies
Install the necessary packages:
npm i pino-opentelemetry-transport
Setup
Step 1. Configure Pino Logger
//tracing.js
const pino = require('pino')

const transport = pino.transport({
  target: 'pino-opentelemetry-transport'
})

const logger = pino(transport)

module.exports = logger
Step 2. Configure Application Logging
//app.js
const logger = require('./tracing');

// Basic logging
logger.info('Hello, World! from pino');

// Structured logging with metadata
logger.info('User authentication', {
    userId: 'user123',
    action: 'login',
    timestamp: new Date().toISOString()
});

// Error handling example
try {
    throw new Error('Something went wrong');
} catch (error) {
    logger.error({
        msg: 'Error occurred',
        error: error.message,
        stack: error.stack
    });
}
Step 3. Run Your Application
Execute your application with the SigNoz access token:
OTEL_EXPORTER_OTLP_HEADERS="signoz-access-token=your_signoz_ingestion_token" OTEL_EXPORTER_OTLP_LOGS_ENDPOINT=https://ingest.{region}.signoz.cloud:443/v1/logs OTEL_RESOURCE_ATTRIBUTES="service.name=my-service,service.version=1.2.3" node -r ./tracing.js app.js
Usage Examples
Basic Logging
logger.info('Server started on port 3000');
logger.warn('High memory usage detected');
logger.error('Failed to process request');
Output
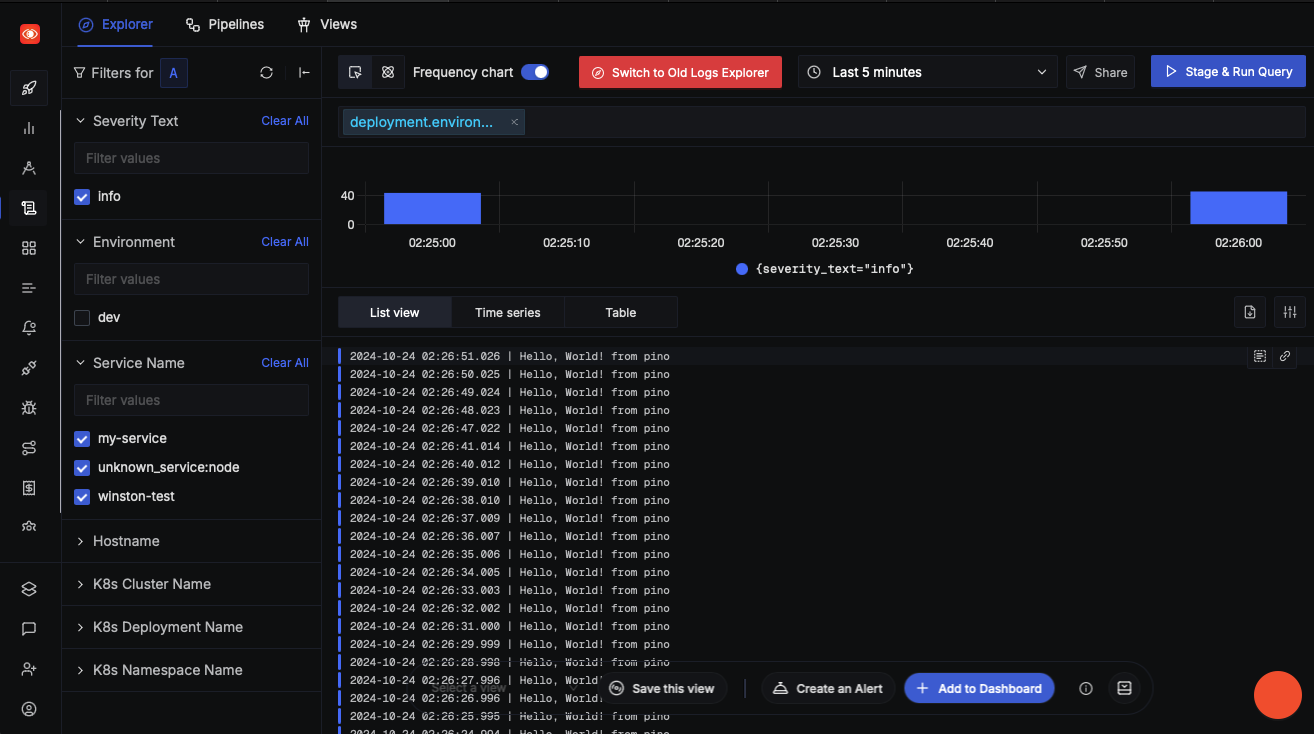
After successful implementation, your logs will appear in your SigNoz Cloud dashboard where you can:
- Monitor logs in real-time
- Filter logs by level and custom attributes
- Search through log contents
- Create alerts based on log patterns
- Visualize log trends and patterns

Node.js Pino Logs
Log from SigNoz dashboard
Troubleshooting
If logs are not appearing in SigNoz:
- Verify your Ingestion Keys and endpoint URL
- Ensure the transport is properly configured
- Review SigNoz dashboard filters
- Check Pino log level settings
Additional Resources
Was this page helpful?
On this page
